

This blog explains how Uber earns money through ride-sharing, delivery, commissions, subscriptions, and advertising. It breaks down driver payouts, operational costs, pricing models, and the company’s evolving business strategy within the modern gig economy.
When you request a ride home or order takeout through a smartphone app, the transaction feels instantaneous and simple. A driver arrives, you get to your destination or receive your meal, and the payment is handled invisibly in the background. It pioneered this seamless experience, fundamentally changing urban mobility and food delivery across the globe.
Behind that simple interface lies a complex financial machine. Passengers and restaurant customers pay a set fee, but the money does not go straight into the driver’s pocket. It filters through a web of service fees, local taxes, insurance premiums, and corporate commissions. For anyone participating in the gig economy, a common question naturally arises. Just how much does It get from every transaction?
Understanding the financial mechanics of this platform requires looking past the individual ride. It operates a multifaceted business model that spans multiple industries. This post breaks down exactly how the company generates income, what percentage it takes from independent earners, and where all that money ultimately goes.
Examining Uber’s Core Revenue Streams
Uber does not own the cars, and it does not cook the food. The company acts as a digital broker, connecting supply with demand and taking a cut for providing the marketplace. This brokering happens across a few distinct segments. To answer how much Uber gets, we must first look at these individual divisions.
Mobility (Ride-Sharing)
The original and most recognizable branch of the business is mobility. This includes UberX, UberXL, and luxury options like It and Black. The platform generates revenue by taking a service fee from every completed trip. When riders ask how much Uber gets, they are usually thinking about this specific service fee.
Understanding the Mobility Revenue Model
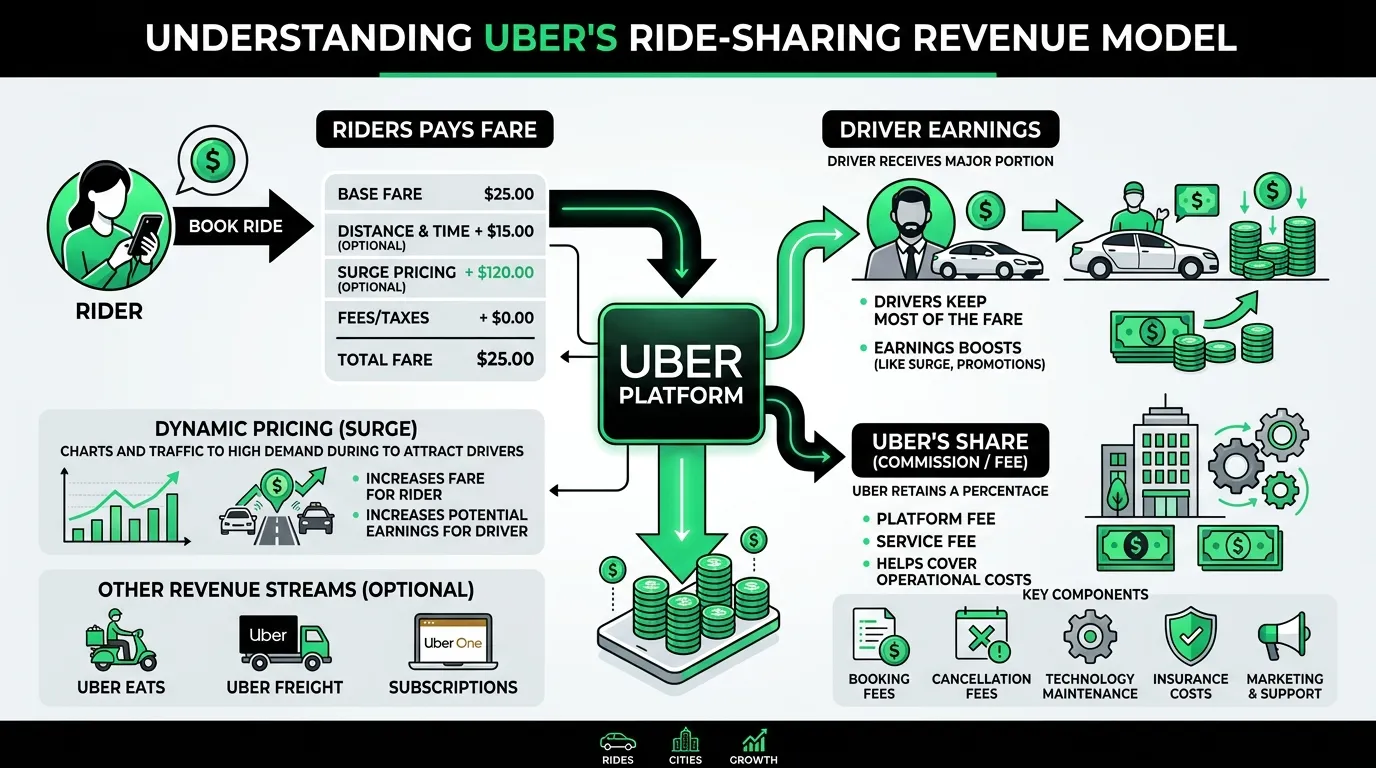
Every ride booked through Uber’s mobility segment triggers a flow of revenue and fees. Uber sets upfront fares based on predicted demand, route, weather, local events, and traffic conditions. This dynamic approach allows the app to optimize pricing in real-time, adapting to rider behavior and market fluctuations across different cities and time frames. Factors such as ride-hailing demand, pick-up distances, and journey lengths are baked into the price you see when opening the app. A portion is withheld as It commission, and the remainder is paid to the driver, minus any applicable local levies or tolls.
Types of Rides and Specialized Offerings
While UberX is the standard, the company also offers specialized options like Uber Pool, which lets riders share a trip (and cost) with others. There’s also Uber WAV for wheelchair-accessible rides. These variants optimize car utilization and sometimes impact the effective ride-sharing fees It can charge per passenger, slightly altering the net income share retained by the platform.
Delivery (Uber Eats)
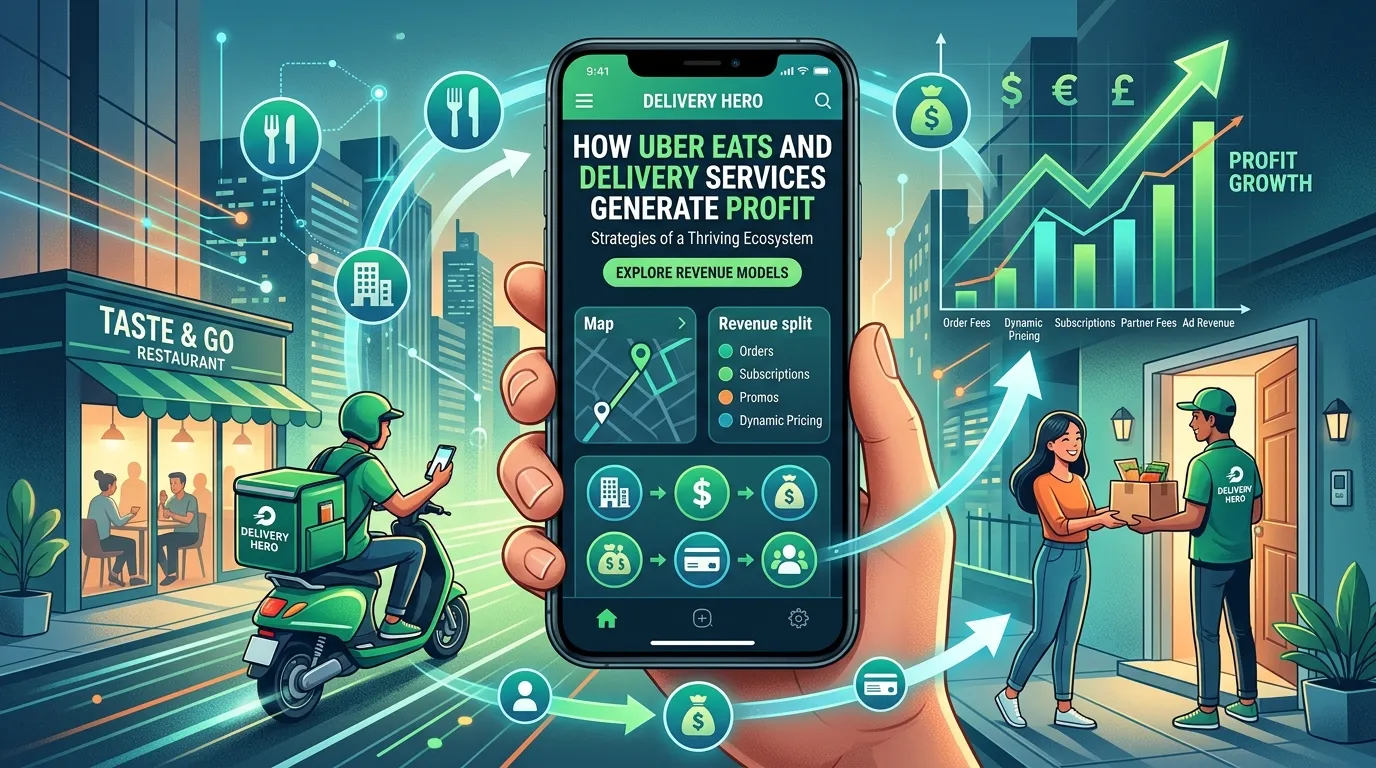
Food and grocery delivery became a massive component of the company’s portfolio over the last few years. Revenue here is multi-layered. Customers pay delivery and service fees, while restaurants pay a commission to be listed on the app. This means Uber takes a slice from both the consumer and the merchant for a single order.
Multiple Streams in Delivery
Uber Eats doesn’t just generate profit from riders ordering food. The platform’s income model is built around several key elements:
- Service Fees from Customers: Each order includes a service fee, which can be dynamic based on order size, distance, and demand.
- Delivery Fees: Calculated according to surge demand, delivery distance, and sometimes restaurant-specific factors.
- Commissions from Restaurants: It takes a pre-negotiated percentage of each order’s food subtotal, typically ranging between 15% and 30%. This incentivizes restaurants to participate but still allows Uber to profit.
- Boosted Placement Fees: Restaurants can opt to boost their listings to the top of search results or appear as “Featured,” which generates extra advertising revenue.
- Subscription Services: The company now offers Uber Eats Pass/Uber One, a monthly subscription for free or reduced delivery fees and member-specific discounts, layering another revenue stream for predictable, recurring income.
Grocery, Alcohol, and Beyond
The delivery arm extends to groceries, essential goods, and—where local laws allow—alcohol deliveries. Each order carries additional platform service surcharges. All lines bolster the company’s overall take rate, adding to how much It gets per order beyond pure food delivery.
Freight and Advertising
Beyond moving people and takeout boxes, Uber matches shippers with carriers through Uber Freight. Additionally, the company has built a lucrative advertising network. Restaurants pay to boost their visibility on It Eats, and brands purchase display ads that appear while riders wait for their cars.
The Freight Business
Uber Freight acts similarly to the ride-sharing model, but in the logistics sector. By digitizing freight matching, It earns a commission for each load matched between shippers and truck drivers. Uber’s income model in this space is rapidly evolving, experimenting with managed transportation and value-added logistics services.
Advertising as a Revenue Multiplier
Uber’s advertising ecosystem is built directly into both the rider and Eats apps. The more data Uber collects, the better it tailors promotions, driving up ad efficacy. Sponsored results, in-app banners, and offers like “Buy One, Get One Free” deals generate additional income streams. Over time, these ads can command premium rates, further lifting the platform’s revenue as It leverages its extensive user base.
Commission Rates and Driver Earnings: How Much Does Uber Get?
The most debated aspect of the platform’s financial model is the split between the corporation and the worker. Uber traditionally advertised that it took a 25 percent commission on the time and distance rates of a fare.
The Shift to Upfront Pricing
However, the reality of modern driver pay is more complicated. The company shifted to an upfront pricing model in many markets. Riders see a guaranteed price before they book, and drivers see a guaranteed payout before they accept. This uncoupling means the exact percentage fluctuates wildly from trip to trip.
Complex Variables Behind Pay
With upfront pricing, the “take rate” (percentage Uber keeps) is not always transparent to either rider or driver. Sometimes, drivers earn more than the advertised percentage if It discounts a fare for promotional reasons but doesn’t cut their payout. Other times, a combination of booking fees, cleaning fees, surcharges, and regional pricing strategies drives down the effective payer earnings.
Promotions, Incentives, and Bonuses
Uber frequently employs promotions like “Quest” or “Boost,” which offer drivers extra income for completing multiple trips. These bonuses supplement their take-home pay but are calculated strategically to maximize active driver supply at peak times while still controlling Uber’s own bottom line. These elements, while beneficial to drivers in the short-term, are algorithmically optimized by Uber to maintain dominance over competitor apps and ensure high utilization rates.
Factoring in Surge Pricing
On some rides, particularly during high surge pricing, Uber might take a smaller percentage to incentivize drivers to log on. On other routine trips, service fees and booking fees can push the company’s effective take rate closer to 30 or 40 percent. Drivers also keep 100 percent of their tips. The lack of a fixed, transparent percentage often causes frustration among drivers trying to predict their hourly earnings.
Impact of Local Regulations
Many cities now require platforms to display how much each party receives from a trip, making some forms of hidden pricing less common. Local governments may also regulate maximum take rates, driver minimums, or require pay disclosures for gig work. Regulations differ drastically by city, adding complexity to the conversation of how much Uber actually gets per ride.
Fee Breakdown
To visualize how much Uber gets on an average ride, here is a theoretical breakdown of a typical fare.
|
Fare Component |
Payer |
Approximate Percentage |
Destination |
|---|---|---|---|
|
Driver Payout |
Rider |
50% – 70% |
Driver’s Bank Account |
|
Booking Fee |
Rider |
10% – 15% |
Uber (Tech/Admin) |
|
Service Fee |
Rider/Driver |
15% – 25% |
Uber (Commission) |
|
Local Taxes/Tolls |
Rider |
5% – 10% |
Local Government |
Real-World Pay Examples
- Short Rides: These often show a higher percentage cut for Uber due to fixed booking fees making up a larger share of the fare.
- Longer Trips: Drivers may receive a higher payout relative to the fare, as variable distance/time rates compound and booking fees represent a lower percent of the total.
A Deep Dive into Financial Performance
For a long time, the narrative surrounding this tech giant was one of massive growth accompanied by massive losses. The company subsidized rides to capture market share, operating at a steep deficit.
Gross Bookings vs. Net Revenue
That narrative shifted recently. Through aggressive cost-cutting, algorithmic improvements, and economies of scale, It achieved operating profitability. The company measures its success primarily through Gross Bookings, which is the total dollar amount spent on the platform. Net revenue is the portion of those bookings the company actually retains.
To understand the broader economic picture, learn how ridesharing companies make money in today’s market. The platform’s ability to turn high gross bookings into positive cash flow marked a major milestone in proving the long-term viability of the gig economy model.
Key Financial Terms
- Gross Bookings: The total amount riders and eaters pay before any deductions.
- Adjusted Net Revenue: The portion left over after paying driver, courier, and restaurant payouts.
- Contribution Margin: Net revenue minus direct variable costs (such as insurance but before overhead or R&D).
How Uber Reports Numbers
Analysts and shareholders focus heavily on metrics such as Adjusted EBITDA (Earnings Before Interest, Taxes, Depreciation, and Amortization) and Free Cash Flow. A profitable quarter requires Uber to keep costs such as insurance, customer support, and legal compliance below the revenue it receives from millions of global transactions.
Operational Costs: Where Does the Money Go?
You might wonder why a software company that does not own vehicles has such high expenses. Running a global logistics network requires heavy and continuous investment. When figuring out how much Uber get, you must also look at how much it spends.
Insurance and Safety Initiatives
A massive portion of Uber’s budget goes toward commercial auto insurance. Every active ride requires liability coverage, which costs the company billions of dollars annually. Safety initiatives, background checks, and a 24/7 incident response team also require significant funding.
- Commercial auto liability insurance
- Continuous driver background checks
- 24/7 safety and incident response teams
Uber must fund new safety tools (such as GPS ride tracking, in-app emergency assistance, and live support agents) to fulfill both regulatory mandates and brand promises. It also invests in fraud prevention, cybersecurity, and data privacy to maintain trust and avoid costly breaches or penalties.
Technology, R&D, and Marketing
Maintaining the application infrastructure is expensive. The company employs thousands of engineers to optimize routing algorithms, predict demand, and maintain app stability. Marketing also eats up a large chunk of revenue. Uber constantly offers rider discounts, promo codes, and driver sign-up bonuses to maintain its user base.
Investing in the App Ecosystem
Uber constantly refines its algorithms to optimize car pooling, minimize rider wait times, and balance supply/demand in target cities. App innovation, regular updates, and multi-language localization all feed into ongoing R&D costs. Machine learning models that predict trip demand and optimize driver dispatch are non-trivial investments.
Brand-Building and Retention
Ongoing digital and real-world advertising, sponsorships, influencer campaigns, and incentive programs keep Uber top-of-mind and fend off encroaching competition. These investments ensure that the app remains the platform of choice for both sides of the marketplace.
The Competitive Landscape and Market Pressures
Uber does not operate in a vacuum. The amount it can charge consumers and the cut it can take from drivers are heavily influenced by market competition. This directly impacts how much Uber gets per transaction.
Ride-Sharing Rivals
In the United States, Lyft is the primary rival for ride-sharing. If Uber’s prices get too high, riders simply open the Lyft app. If Uber’s driver payouts get too low, drivers switch over to the competitor. Internationally, the company faces local giants like Didi in China, Ola in India, and Bolt in Europe.
Regional Strategies
In some countries, It must partner, acquire, or exit due to well-established regional players. Each competitive market impacts the percentage It can command through commission adjustments, customer promotions, and merchant incentives.
Food Delivery Wars
The delivery sector is even more fragmented. DoorDash holds a commanding lead in US food delivery, forcing Uber Eats to spend heavily on marketing and merchant partnerships to secure its market share. This fierce competition keeps profit margins relatively thin across the entire sector.
Local Promotions and Partnerships
Uber Eats often secures exclusive partnerships with major chains for a temporary competitive edge, offering lower delivery fees or special menu items to woo customers. These competitive dynamics ripple through every market, impacting how much Uber gets to keep in any given region or vertical.
Regulatory and Legal Challenges Impacting Margins
Local laws have a direct impact on how much Uber gets to keep. Governments around the world frequently challenge the company’s classification of drivers as independent contractors.
Independent Contractors vs. Employees
If forced to classify drivers as employees, the company would have to pay minimum wage guarantees, overtime, health benefits, and payroll taxes. This would fundamentally alter the financial structure of the business. We have already seen compromises that kept drivers as contractors but mandated certain earnings floors.
Global Patchwork of Laws
Some governments require gig companies to provide paid sick leave, health stipends, or occupational accident insurance. Policy changes like California’s Proposition 22 are increasingly common and can swing Uber’s reported take rate for entire markets up or down year-over-year.
Local Tax and Commission Caps
Additionally, some cities impose caps on the commissions delivery apps can charge restaurants. Others levy specific taxes on ride-sharing trips to fund public transportation. Navigating these fragmented, city-by-city regulations requires a massive legal team and lobbying budget.
Environmental and Accessibility Regulations
Some localities have introduced zero-emission targets for ride-hailing platforms or mandated minimum accessible vehicle quotas. Achieving compliance requires heavy investment in driver education, EV incentives, and new features—all of which increase operational costs and reduce the percentage of each fare Uber retains.
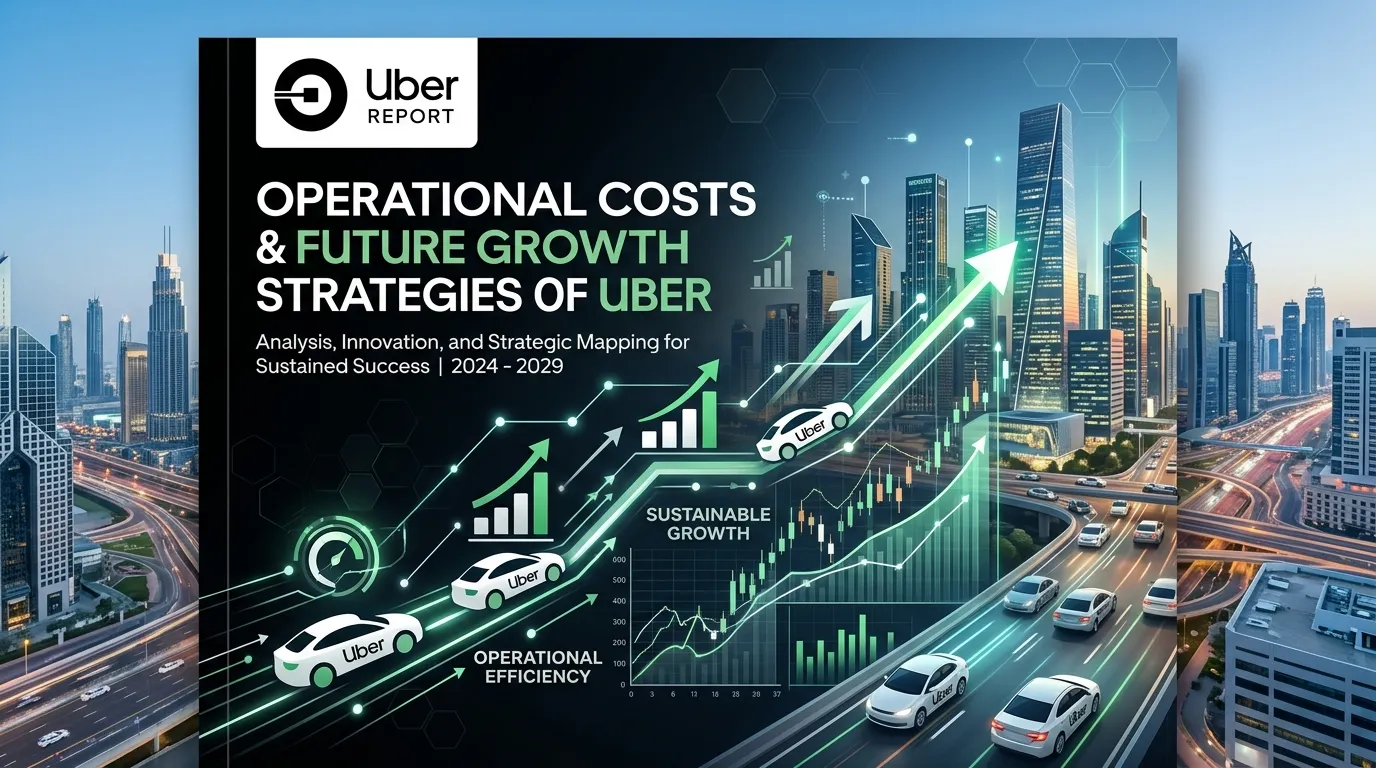
Future Strategies for Sustainable Growth
To ensure long-term sustainability, the company is focusing on predictable, recurring revenue. This shifts the focus from how much It gets per ride to how much it gets per user per month.
Subscription Models (Uber One)
The introduction of the Uber One subscription model represents a major shift. By paying a flat monthly fee, users get discounted rides and free delivery. This locks consumers into the ecosystem and guarantees a steady stream of income for the company.
Evolution of Platforms
Uber is increasingly bundling services to boost customer retention. Uber One unites ride-sharing, food delivery, and other services, extracting greater average revenue per user while reducing marketing expenses through bundled rewards.
Autonomous Vehicles
Looking further ahead, autonomous vehicles remain the ultimate goal. Removing the cost of human labor from the equation would drastically increase the company’s profit margins, though widespread implementation remains years away.
Integration of Micro-Mobility
Beyond cars and food, Uber now offers e-bike and scooter rentals in select cities, further diversifying its transportation portfolio. While these ventures may carry smaller margins initially, they capture a broader spectrum of urban transit needs—giving It room to grow its total user base and create new income models.
The Bottom Line on Platform Earnings
Determining exactly how much It gets is not a simple calculation. While the company takes a noticeable cut from every individual ride and food order, those fractions of a dollar must cover massive global infrastructure, insurance policies, and marketing efforts.
From technological innovation and competitive battles to legal challenges and evolving customer expectations, Uber’s share of each fare is in constant flux. The platform has finally proven it can generate consistent profits, but it must constantly balance the needs of three distinct groups: riders who want low prices, drivers who need livable wages, and shareholders who demand growth.
As It faces new challenges in the evolving gig economy and continues to expand into freight, grocery, autonomous tech, and beyond, the precise answer to “how much does Uber get” will continue to shift. For users and drivers alike, understanding these dynamics is key to making informed decisions—whether booking a ride, signing up to drive, or considering the stock.
Frequently Asked Questions
How much does it get from a typical ride fare?
Uber generally takes anywhere from 20% to 40% of the total fare paid by the rider. This percentage fluctuates based on the upfront pricing model, booking fees, and the current market demand during the trip.
Do Uber drivers get 100% of their tips?
Yes, Uber drivers keep exactly 100% of the tips provided by passengers. The company does not take any commission or service fee out of the gratuity left through the application or given in cash.
Why does the amount Uber takes change on every ride?
Uber uses dynamic upfront pricing, meaning they charge the rider what the algorithm predicts they are willing to pay, while offering the driver a set rate for the distance. This uncoupling causes the percentage split to vary wildly.
Does Uber make a profit?
After years of operating at a steep deficit to gain market share, It recently achieved operating profitability. They accomplished this by cutting costs, optimizing their algorithms, and scaling their high-margin advertising business.
How much does Uber get from restaurant delivery orders?
Uber Eats typically charges restaurants a commission rate of 15% to 30% on the subtotal of every order. Additionally, they collect delivery and service fees directly from the consumer placing the order.
How do I know if Uber is offering the best price?
Prices change constantly based on driver availability and local traffic patterns. To ensure you get the best rate, find out if Lyft or Uber is cheaper for your next ride by comparing both apps before booking.
What are Uber’s biggest operational expenses?
The company spends billions of dollars annually on commercial auto insurance for its drivers. Other massive expenses include software research and development, legal lobbying, and global marketing campaigns to attract new users.
How does the Uber One subscription change their revenue?
Uber One provides the company with predictable, recurring monthly revenue. It also incentivizes subscribers to use It exclusively for both rides and food delivery, increasing the overall lifetime value of that customer.
Does Uber pay for driver gas and vehicle maintenance?
No, drivers are classified as independent contractors, meaning they are responsible for all their own expenses. Drivers must cover their own fuel, vehicle depreciation, maintenance, and personal insurance costs out of their earnings.
Will self-driving cars change how much Uber makes?
Yes, replacing human drivers with autonomous vehicles would eliminate the largest expense in the ride-sharing model. This transition would allow it to keep a much larger percentage of every fare, dramatically increasing profit margins.